


Notices
- Legal notice regarding the use of this content
- Differences between analysis values and forecast values
- Data quality
Legal notice regarding the use of this content
The copyright of all JRA-55 Atlas content is as per the Japan Meteorological Agency Website Terms of Use.
Users should specify the data source as in the following example when using the content elsewhere:
Source: JRA-55 Atlas (http://jra.kishou.go.jp/JRA-55/atlas/en/)
Differences between analysis values and forecast values
The JRA-55 Atlas contains analysis values and forecast values.
Figures on this website are produced with analysis values wherever possible.
The differences between analysis values and forecast values are outlined in brief below.
JRA-55 data is based on data assimilation and numerical forecast systems.
Data assimilation helps to clarify the spatial distribution of atmospheric variables
with physical consistency using first-guess and observational data.
The first guess is the most plausible spatial distribution of atmospheric variables
based on prior knowledge and other factors,
while analysis values are based on the first guess corrected using observational data.
The JRA-55 system produces continuous long-term data by performing data assimilation cycles every six hours.
Forecast values are calculated using a numerical forecasting model with analysis data from six hours
ago as an initial condition,
while analysis values are determined by correcting first-guess forecast values using observational data.
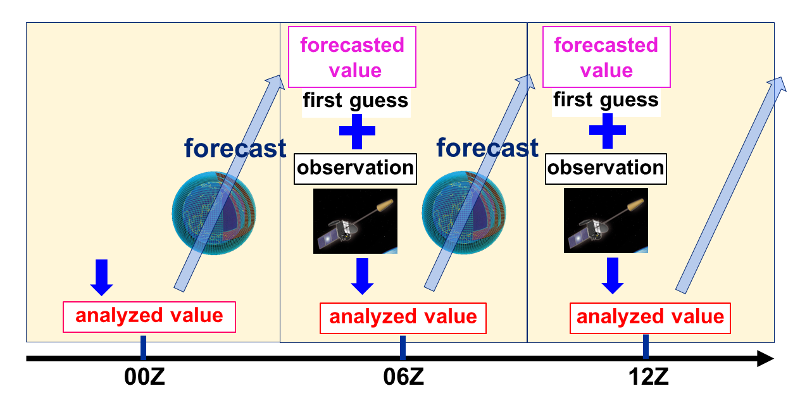
The quality of analysis values is generally considered better than that of forecast values
due to this correction.
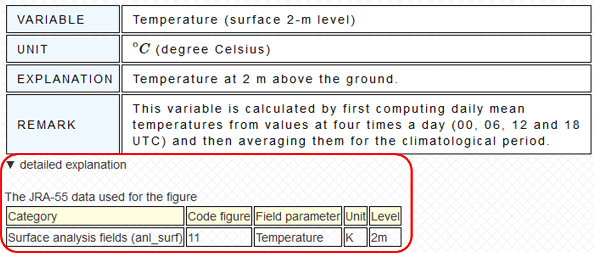
However, analysis values are not produced for all variables; precipitation, for example,
has no analysis values because observational precipitation data are not used in data assimilation.
The figure commentaries provide information on the data used.
By way of example, Fig. 2 (an example of surface 2-m temperature) is based on surface analysis data.
Data quality
As outlined in the section on differences between analysis values and forecast values,
JRA-55 is an atmospheric dataset with physical consistency.
However, its values are estimates based on a numerical forecasting model and observational data.
Accordingly, users should note that the figures and numerical data provided in the JRA-55 Atlas
may have some degree of error.
See the conventional report on JRA-55
(Kobayashi et al. 2015)
for details of related characteristics and quality evaluations.
Temperature and precipitation which are analysis and forecast values respectively, are shown below as examples of JRA-55 evaluation.
CLIMAT surface monthly observational data are used for comparison.
It should be noted that JRA-55 presents mean values based on a model grid, while CLIMAT contains point data.
CLIMAT is monthly world climate data derived via the GTS line from WMO Members around the world.
Figure 3 indicates seasonal changes in surface temperature (JRA-55 shows surface 2-m temperature)
for six major cities around the world.
It can be seen that the JRA-55 values show a clear correlation with observation data.
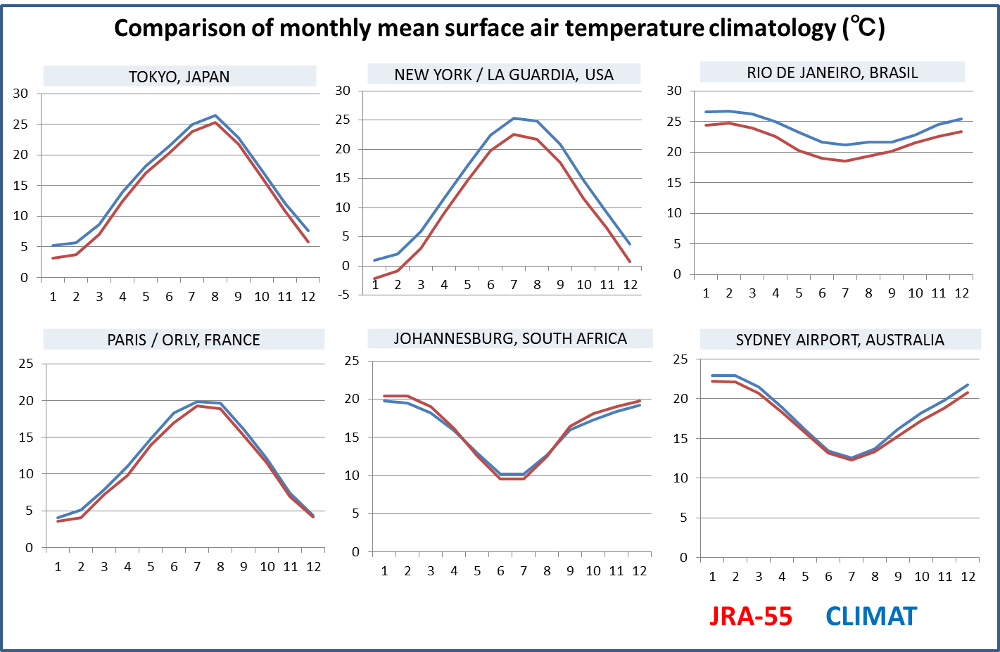
Figure 4 shows a comparison of seasonal changes in precipitation in India,
where seasonal variations are very large.
Although both JRA-55 and observational data exhibit similar seasonal changes,
quantitative differences are seen in some places.
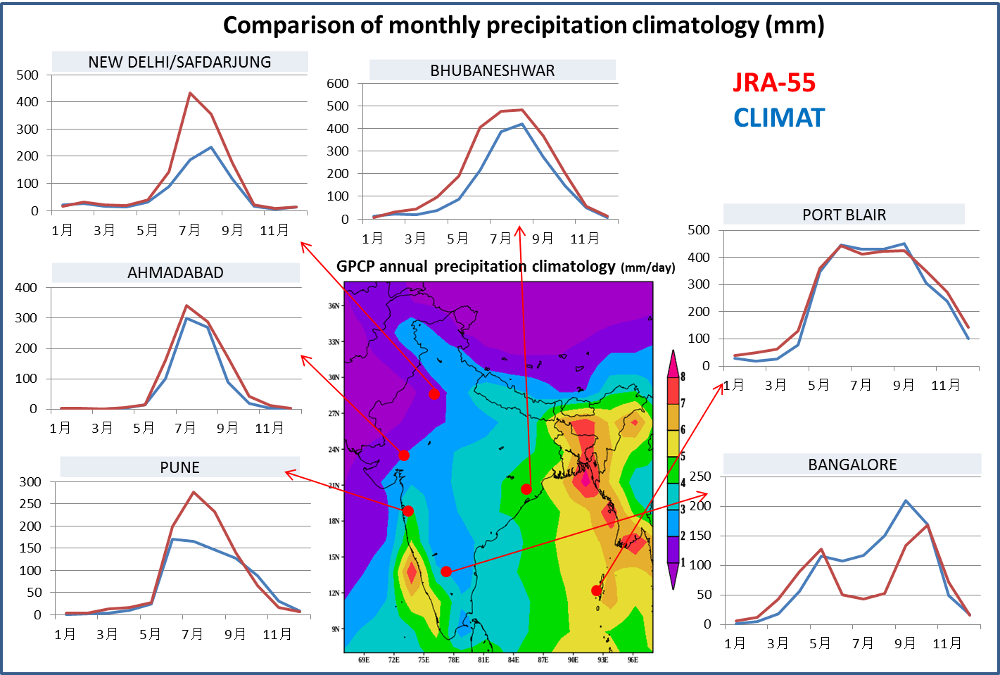
As shown in figure 3 and 4, analysis value tends to have a better consistency with observational one than forecast value.
See the figure commentaries which provide information on the data used.