


Production method
Calculation Making figure References
- The figures of JRA-55 ATLAS were calculated using the Japanese 55-year reanalysis (JRA-55, Kobayashi et al. 2015).
- The climatology (normal value) was calculated by 30-year data from 1981 to 2010, but a part of figures were calculated with data from 1958, a beginning of JRA-55.
- Climatologies were calculated for annual, seasonally and monthly. Seasons are divided to four as DEC-JAN-FEB (DJF), MAR-APR-MAY (MAM), JUN-JUL-AUG (JJA) and SEP-OCT-NOV (SON).
- Calculations were performed with 6-hourly analysis and forecast data of JRA-55. Analysis data was prior to use if required elements were contained in both analysis and forecast.
- Although JRA-55 provides the following two different horizontal grids the former was used with priority.
- 1: Model grid (TL319 reduced Gaussian grid, corresponding approximately 55-km horizontal resolution)
- 2: 1.25-degree latitude/longitude grid
- Numerical data file with CSV format has 1.25 degree latitude/longitude grid, even if the figure was calculated with model grid data.
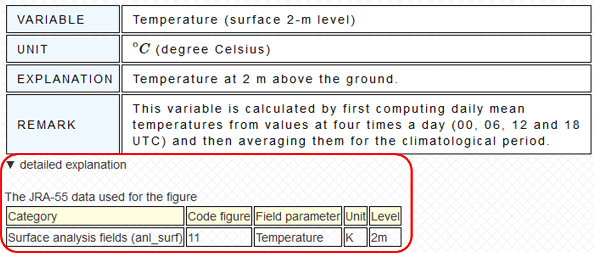
- The detailed explanation of figure is shown in a pop-up window when you click a button "explanation" located under the figure.
- The figure commentaries provide information on the data used.
See JRA-55 Manual for details of the data.
- Grid Analysis and Display System (GrADS) version 2.1.a2 was used to draw figure.
- Color palette of "color 1" is based on rainbow color, while "color 2" is based on the Brewer color which is a fruits of study by Dr. Cynthia A. Brewer, a professor of geography at the Pennsylvania state university.
The following papers are refereed in the calculation of JRA-55 Atlas.
- Adler, R. F., G. J. Huffman, A. Chang, R. Ferraro, P. Xie, J. Janowiak, B. Rudolf, U. Schneider, S. Curtis, D. Bolvin, A. Gruber, J. Susskind, and P. Arkin, 2003: The Version 2 Global Precipitation Climatology Project (GPCP) monthly precipitation analysis (1979-present), J. Hydrometeor., 4, 1147-1167.
- Duchon, C. E., 1979: Lanczos Filtering in one and two dimensions, J. Appl. Meteor., 18, 1016-1022.
- JMA, 2013: JRA-55 Product User's Handbook 1.25-degree latitude/logitude grid data, 22pp.
- JMA, 2014: JRA-55 Product User's Handbook Model grid data, 31pp.
- Kobayashi, S., Y. Ota, Y. Harada, A. Ebita, M. Moriya, H. Onoda, K. Onogi, H. Kamahori, C. Kobayashi, H. Endo, K. Miyaoka, and K. Takahashi, 2015: The JRA-55 reanalysis: General specifications and basic characteristics, J. Meteor. Soc. Japan, 93, 5-48, doi:10.2151/jmsj.2015-001.
- Wheeler, M. C. and H. H. Hendon, 2004: An all-season real-time multivariate MJO index: Development of an Index for Monitoring and Prediction, Mon. Wea. Rev. , 132, 1917-1932.
- Yanai, M., S. Esbensen, and J.-H. Chu, 1973: Determination of bulk properties of tropical cloud clusters from large-scale heat and moisture budgets, J. Atmos. Sci., 30, 611-627.