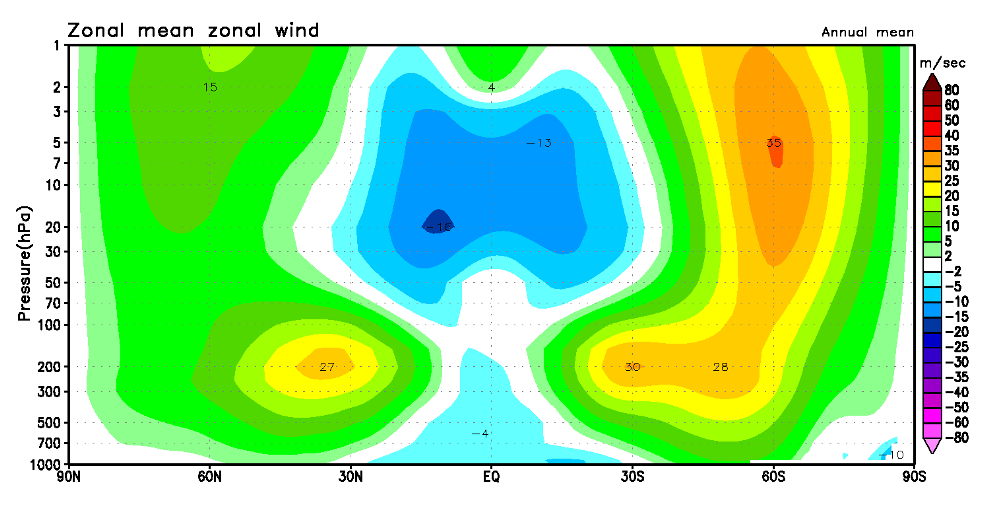
JRA-25 Atlas > Pressure level climatologies (Latitude-height cross sections)
 |
JRA-25 Atlas > Pressure level climatologies (Latitude-height cross sections) |
Figures of 'Northward momentum flux in the upper troposphere' and 'Northward heat flux at 850 hPa' can be found at 'Pressure level climatologies / Latitude-height cross sections / maximum and minimum values not plotted'.

| Elements or projections - Figures with/without maximum and minimum values can be seen in "plotted"/"not plotted" page. | |||
|---|---|---|---|
| Invariants | Surface orography and vegetation (not plotted) | ||
| Surface climatologies | Pressure, wind, temperature (plotted / not plotted) | Radiation (plotted / not plotted) | |
| Precipitation, snow depth, tropical cyclone (plotted / not plotted) | Cloud cover, soil water content (plotted / not plotted) | ||
| Column climatologies | Heating, water vapor, ozone (plotted / not plotted) | ||
| Pressure level climatologies | Latitude-longitude projections (plotted / not plotted) | Polar stereographic projections (plotted / not plotted) | Latitude-height cross sections (plotted / not plotted) |
| Isentropic level climatologies | Latitude-longitude projections, latitude-height cross sections (plotted / not plotted) | Polar stereographic projections (plotted / not plotted) | |
| PV=2 climatologies | Potential temperature, pressure, wind (plotted / not plotted) | ||
| Time series | Height-time cross sections, indices (not plotted) | Time-longitude cross sections, latitude-time cross sections (not plotted) | Tropical cyclone days (not plotted) |

