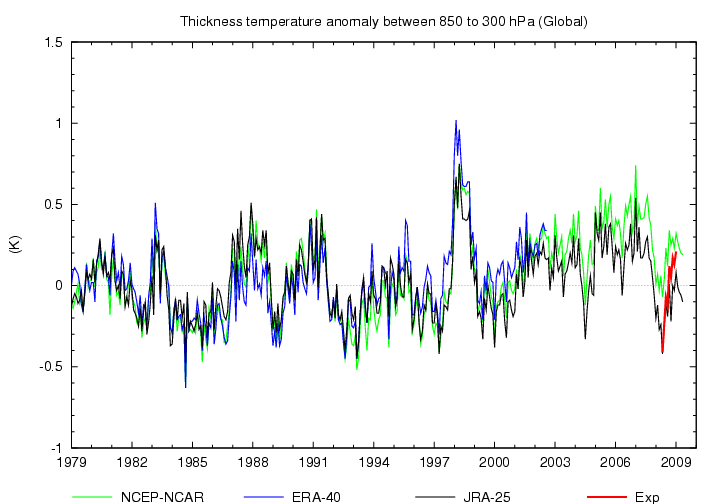
Fig 1 Global monthly mean troposheric thickness temeprature anomalies (850 to 300 hPa)
Last update: 30th June 2009
The following changes will be introduced to JCDAS on 1st July 2009;
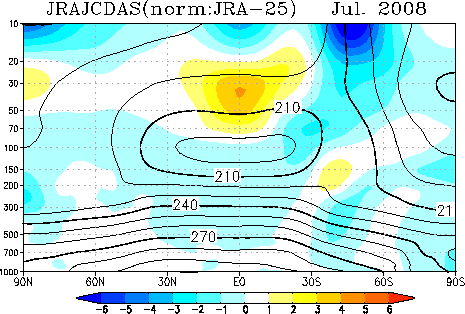
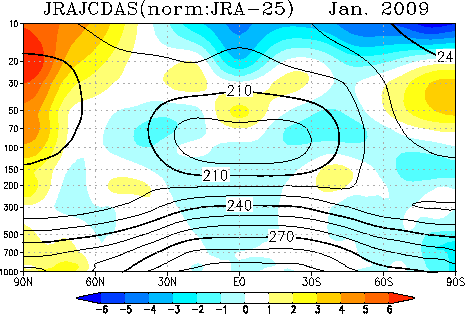
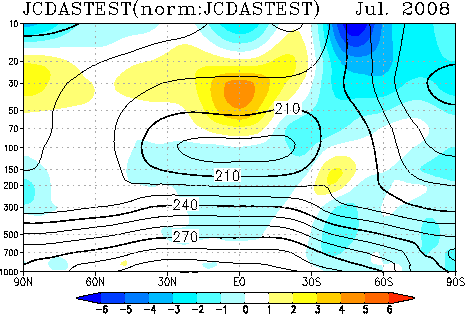
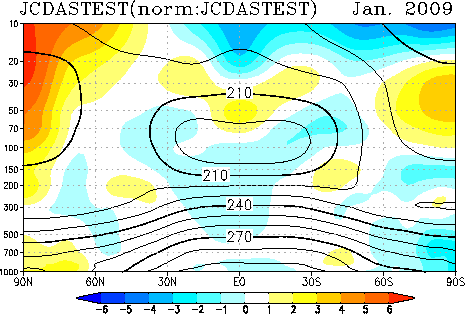
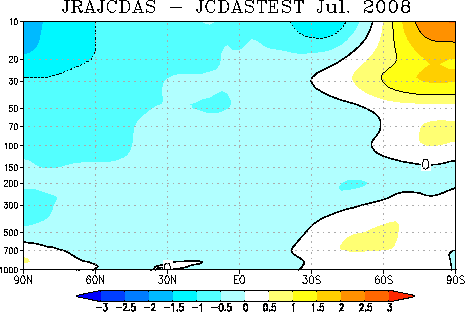
The impact of the changes on the quality of the product has been tested in preliminary experiments. From the comparison between products of the operational JCDAS and of the exmeriments, the following changes in the quality of the product are anticipated;
The primary cause of the changes is most likely to be the introduction of the adaptive bias correction scheme, which optimises bias estimates for AMSU-A radiance observations that have sensitivity to atmospheric temperature. When using the reanalysis product to monitor or study long term climatic trend or low freqency variability, please keep in mind that the quality of the reanalysis product could vary due to changes in the quality of satellite data.

Fig 1 Global monthly mean troposheric thickness temeprature anomalies (850 to 300 hPa)
 |
 |
 |
 |
 |
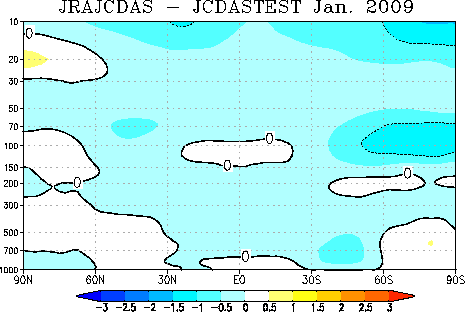 |
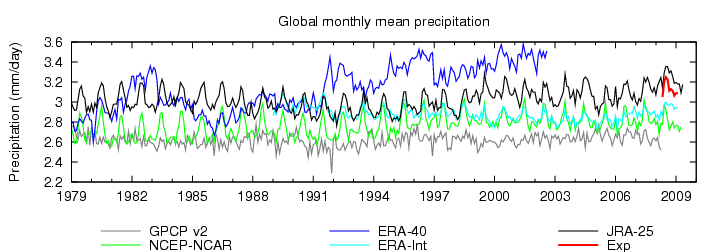
Fig 3 Global monthly mean precipitations
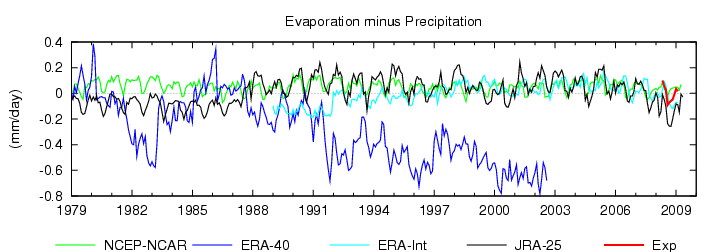
Fig 4 Differences between global monthly mean evapolation and precipitation
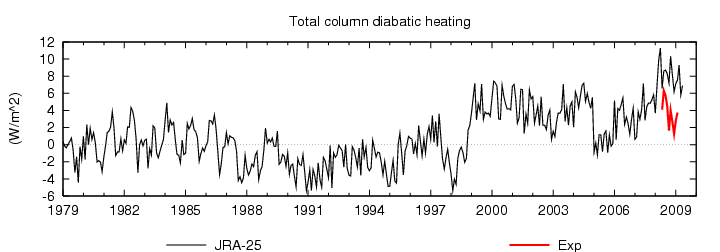
Fig 5 Global monthly mean total column diabatic heatings
Back -->