
December, 2008 updated
Some preliminary results from the reanalysis and notes for JRA-25 users are provided
on this page.
Results from reanalysis |
||||
Globally-averaged Monthly Precipitation |
||||
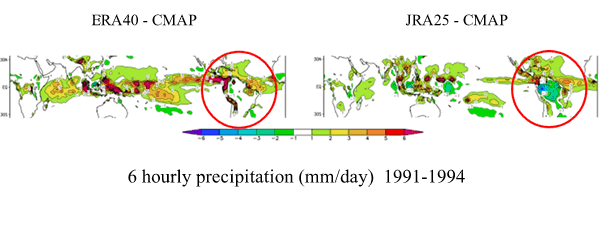
| The precipitation of JRA-25 performs well. Global mean precipitation is the most stable in the reanalyses at around 3mm/day without any evident increase in recent years nor suffering by volcanic eruptions, while the amount is larger than 'observational' precipitation data of GPCP and CMAP. Precipitation in most of reanalyses is higher than GPCP. | ||||
|
|
||||
Representation of Tropical Cyclones |
||
| Using the wind profile retrievals surrounding tropical cyclones (TCR) data results in a more realistic representation of the tropical cyclones (TCs) compared to other reanalyses. An example of analyzed sea level pressure around TCs with observed TC locations in September 1990 in the JRA-25 is shown below. A result from a control experiment that excludes the TCR data from the JRA-25 system is shown for comparison. In the eastern North Pacific (ENP) basin, the quality of represented TCs in terms of location and intensity in JRA-25 is improved compared to that of the control experiment. | ||
|
|
||
Surface Temperature Trends |
||||
| The JRA-25 dataset includes a set of analyses at reference heights near the surface. The JRA-25 surface analysis, which is separated from the three-dimensional variational analysis for the atmosphere, employs a two-dimensional optimum interpolation scheme where various surface observations are assimilated with first-guess fields that are diagnostically obtained from upper-air first-guess fields. This surface analysis method is similar to the methods used in other reanalyses, including ERA-40. Here, monthly means of surface air temperature at a reference height of two meters, which is one of the variables from the surface analysis, are compared with ERA-40 and CRUTEM2v (hereafter CRU). The CRU dataset contains surface air temperature anomalies in 5-deg by 5-deg grid boxes and is used in climate change studies as reference data. It is verified that the three sets of data have similar spatial distributions in specific years and months throughout the entire period. | ||||
|
|
||||
QBO and SAO in the Stratosphere |
||||
| The vertical resolution in the JRA-25 system is as dense around the tropopause and lower stratosphere as that in the ERA-40 system. Stratospheric climate in the JRA-25 (such as temperature and zonal wind) is of good quality. The quasi-biennial oscillation (QBO) of the stratospheric zonal wind in the middle to lower stratosphere and the semi-annual oscillation (SAO) in the upper stratosphere are apparent in this figure and in a power spectrum density analysis. Each phase and amplitude of the QBO and the SAO is almost the same as those represented by ERA-40. | ||||
|
|
||||
Comparison of Ozone and Temperature of JRA-25 and ERA-40 |
||||
|
Ozone density is dominant for the climate in the stratosphere. |
||||
|
|
||||
|
|
||||
|
|
||||
Notes for users |
||
|
|
||
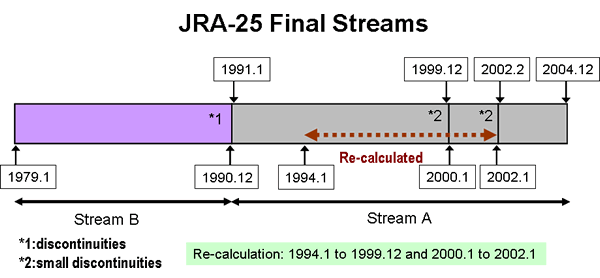
| Furthermore, two recalculations were also required to fix problems caused by data quality. One was due to the low quality of GMS-AMV data from January 1994 to December 1999, while the other was due to a Y2K problem with TCR data from January 2000 to January 2002. There are small discontinuities at the beginning of January 2000 and February 2002. | ||
 |
||
|
|
||
|
|
||
|
|
||
|
|
||
 |
||
|
|
||

|
||
References |
||
|
(ERA-40), Extended abstract of 25th Conference on Hurricanes and Tropical Meteorology, 261-264.
in the Japanese 25-year reanalysis (JRA-25), J. Meteor. Soc. Japan, in press.
|
||
Back to Top Page -->